SIEM integration#️
Get a snapshot of your IT infrastructure in a SIEM monitoring tool.
The Inspector attestation reports connector allows end-users to easily collect attestation events from CanaryBit Inspector and forward them to a telemetry data collector (e.g. FluentBit). The data collector system can then be connected to a monitoring tool (e.g. Grafana, Splunk, or others) for log aggregation and alerting.
graph LR
    B[Canary Bit Connector] <-.GET.-> A[Canary Bit Inspector]
B[Canary Bit Connector] -.-> C[Data Collector] -.-> D[SIEM]- At launch, the Canary Bit Connector locally stores a
last_pollingfile containing the launch timestamp. - At a recurrent schedule, the Canary Bit Connector:
- reads the
last_pollingtimestamp; - fetches the CanaryBit Inspector attestation reports event logs starting from the
last_pollingtimestamp and until the current timestamp; - forwards them to the Data Collector for the specific time range.
- reads the
- The
last_pollingfile is then updated with the current timestamp. - The Data Collector is then responsible to forward the event logs to the configured SIEM/monitoring tool.
Requirements#️
- Access to a CanaryBit Inspector instance
Configuration#️
The following variables are required by the connector:
CB_USERNAMEandCB_PASSWORDfor CanaryBit authentication;TELEMETRY_DATA_COLLECTOR_URIfor shipping the events to a SIEM monitoring tool.
The connector can then be deployed as either a systemd service or as a container.
Note
We recommend to store the environment variables in an .rc (e.g. my-env.rc)
Systemd#️
-
Create both a
.serviceand.timerfile under thesystemddirectory:/etc/systemd/system/connector.service[Unit] Description=CanaryBit Inspector attestation reports connector [Service] Type=oneshot ExecStart=/bin/bash -c 'source my-env.rc && /usr/bin/python3 <PATH>/connector.py/etc/systemd/system/connector.timer[Unit] Description=Run the connector daily [Timer] OnCalendar=daily Persistent=true [Install] WantedBy=timers.target -
Launch the script with:
sudo systemctl daemon-reload
sudo systemctl enable --now connector.timer
Container#️
docker run --rm \
  --network <CUSTOM_NETWORK> \
  -e CB_USERNAME \
  -e CB_PASSWORD \
  -e TELEMETRY_DATA_COLLECTOR_URI \
  -v "./last_polling:/app/last_polling" \
  ghcr.io/canarybit/inspector-attestations-connector:latest
Example#️
In this example we use FluentBit and Grafana as telemetry data collector and monitoring tool, respectively.
-
Create and source a
my-env.rcfile with the following environment variables:export CB_USERNAME=*** export CB_PASSWORD=*** export TELEMETRY_DATA_COLLECTOR_URI=http://fluentbit:9880/attestation.events export LOKI_HOST=logs-prod-XYZ.grafana.net export LOKI_USER=*** export LOKI_PASSWORD=*** -
Configure Loki as FluentBit output plugin:
[SERVICE]
 Flush         1
 Log_Level     info

[INPUT]
    # ---
    # DO NOT REMOVE !!!
    # Receives the results from the connector via http
    # ---
    Name         http
    Listen       0.0.0.0
    Port         9880

[FILTER]
    # ---
    # DO NOT REMOVE !!!
    Parses the attestations input and converts it to a multi-line format
    # ---
    Name    lua
    Match   *
    script  /fluent-bit/etc/filter.lua
    call    split_json

[OUTPUT]
    Name          loki
    Match         *
    Host          ${LOKI_HOST}
    Port          443
    tls           On
    tls.verify    On
    http_user     ${LOKI_USER}
    http_passwd   ${LOKI_PASSWORD}
    # ---
    Labels        job=my_attestations
    # ---
    line_format   json
Info
Label is used to identify the events and query the results in Grafana. In this example, we used
job=my_attestations -
Launch FluentBit:
docker run -d \ --network my-network \ --name fluentbit \ -e LOKI_HOST \ -e LOKI_USER \ -e LOKI_PASSWORD \ -v "$(pwd)/fluent-bit.conf:/fluent-bit/etc/fluent-bit.conf:ro" \ -v "$(pwd)/filter.lua:/fluent-bit/etc/filter.lua:ro" \ --restart unless-stopped \ fluent/fluent-bit:latest \ /fluent-bit/bin/fluent-bit -c /fluent-bit/etc/fluent-bit.conf -
Launch the connector:
docker run --rm \
  --network my-network \
  -e CB_USERNAME \
  -e CB_PASSWORD \
  -e TELEMETRY_DATA_COLLECTOR_URI \
  -v "./last_polling:/app/last_polling" \
  ghcr.io/canarybit/inspector-attestations-connector:latest
Warning
Make sure that both containers are on the same network, in this example we used
my-network. -
Visualise the event logs in Grafana
In Grafana Explore (tab), select the Loki data source connection used to ship the logs to Grafana.
Run the query selecting
job=my_attestationsas Label Filter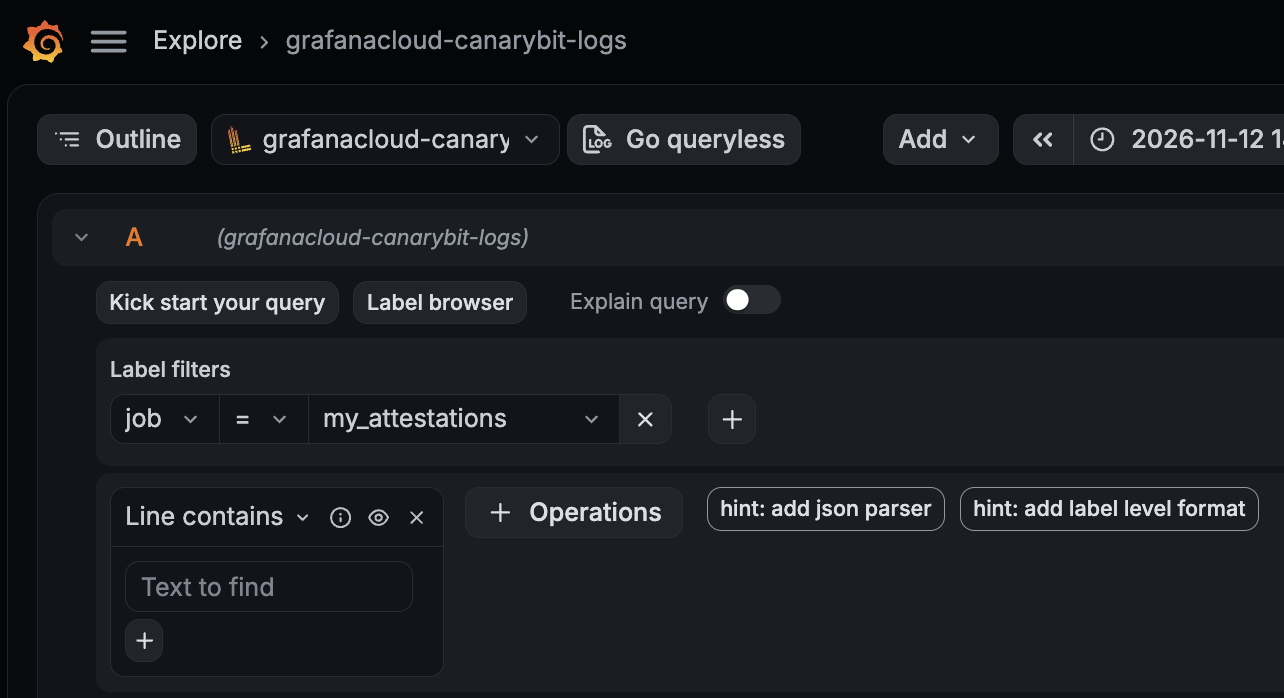
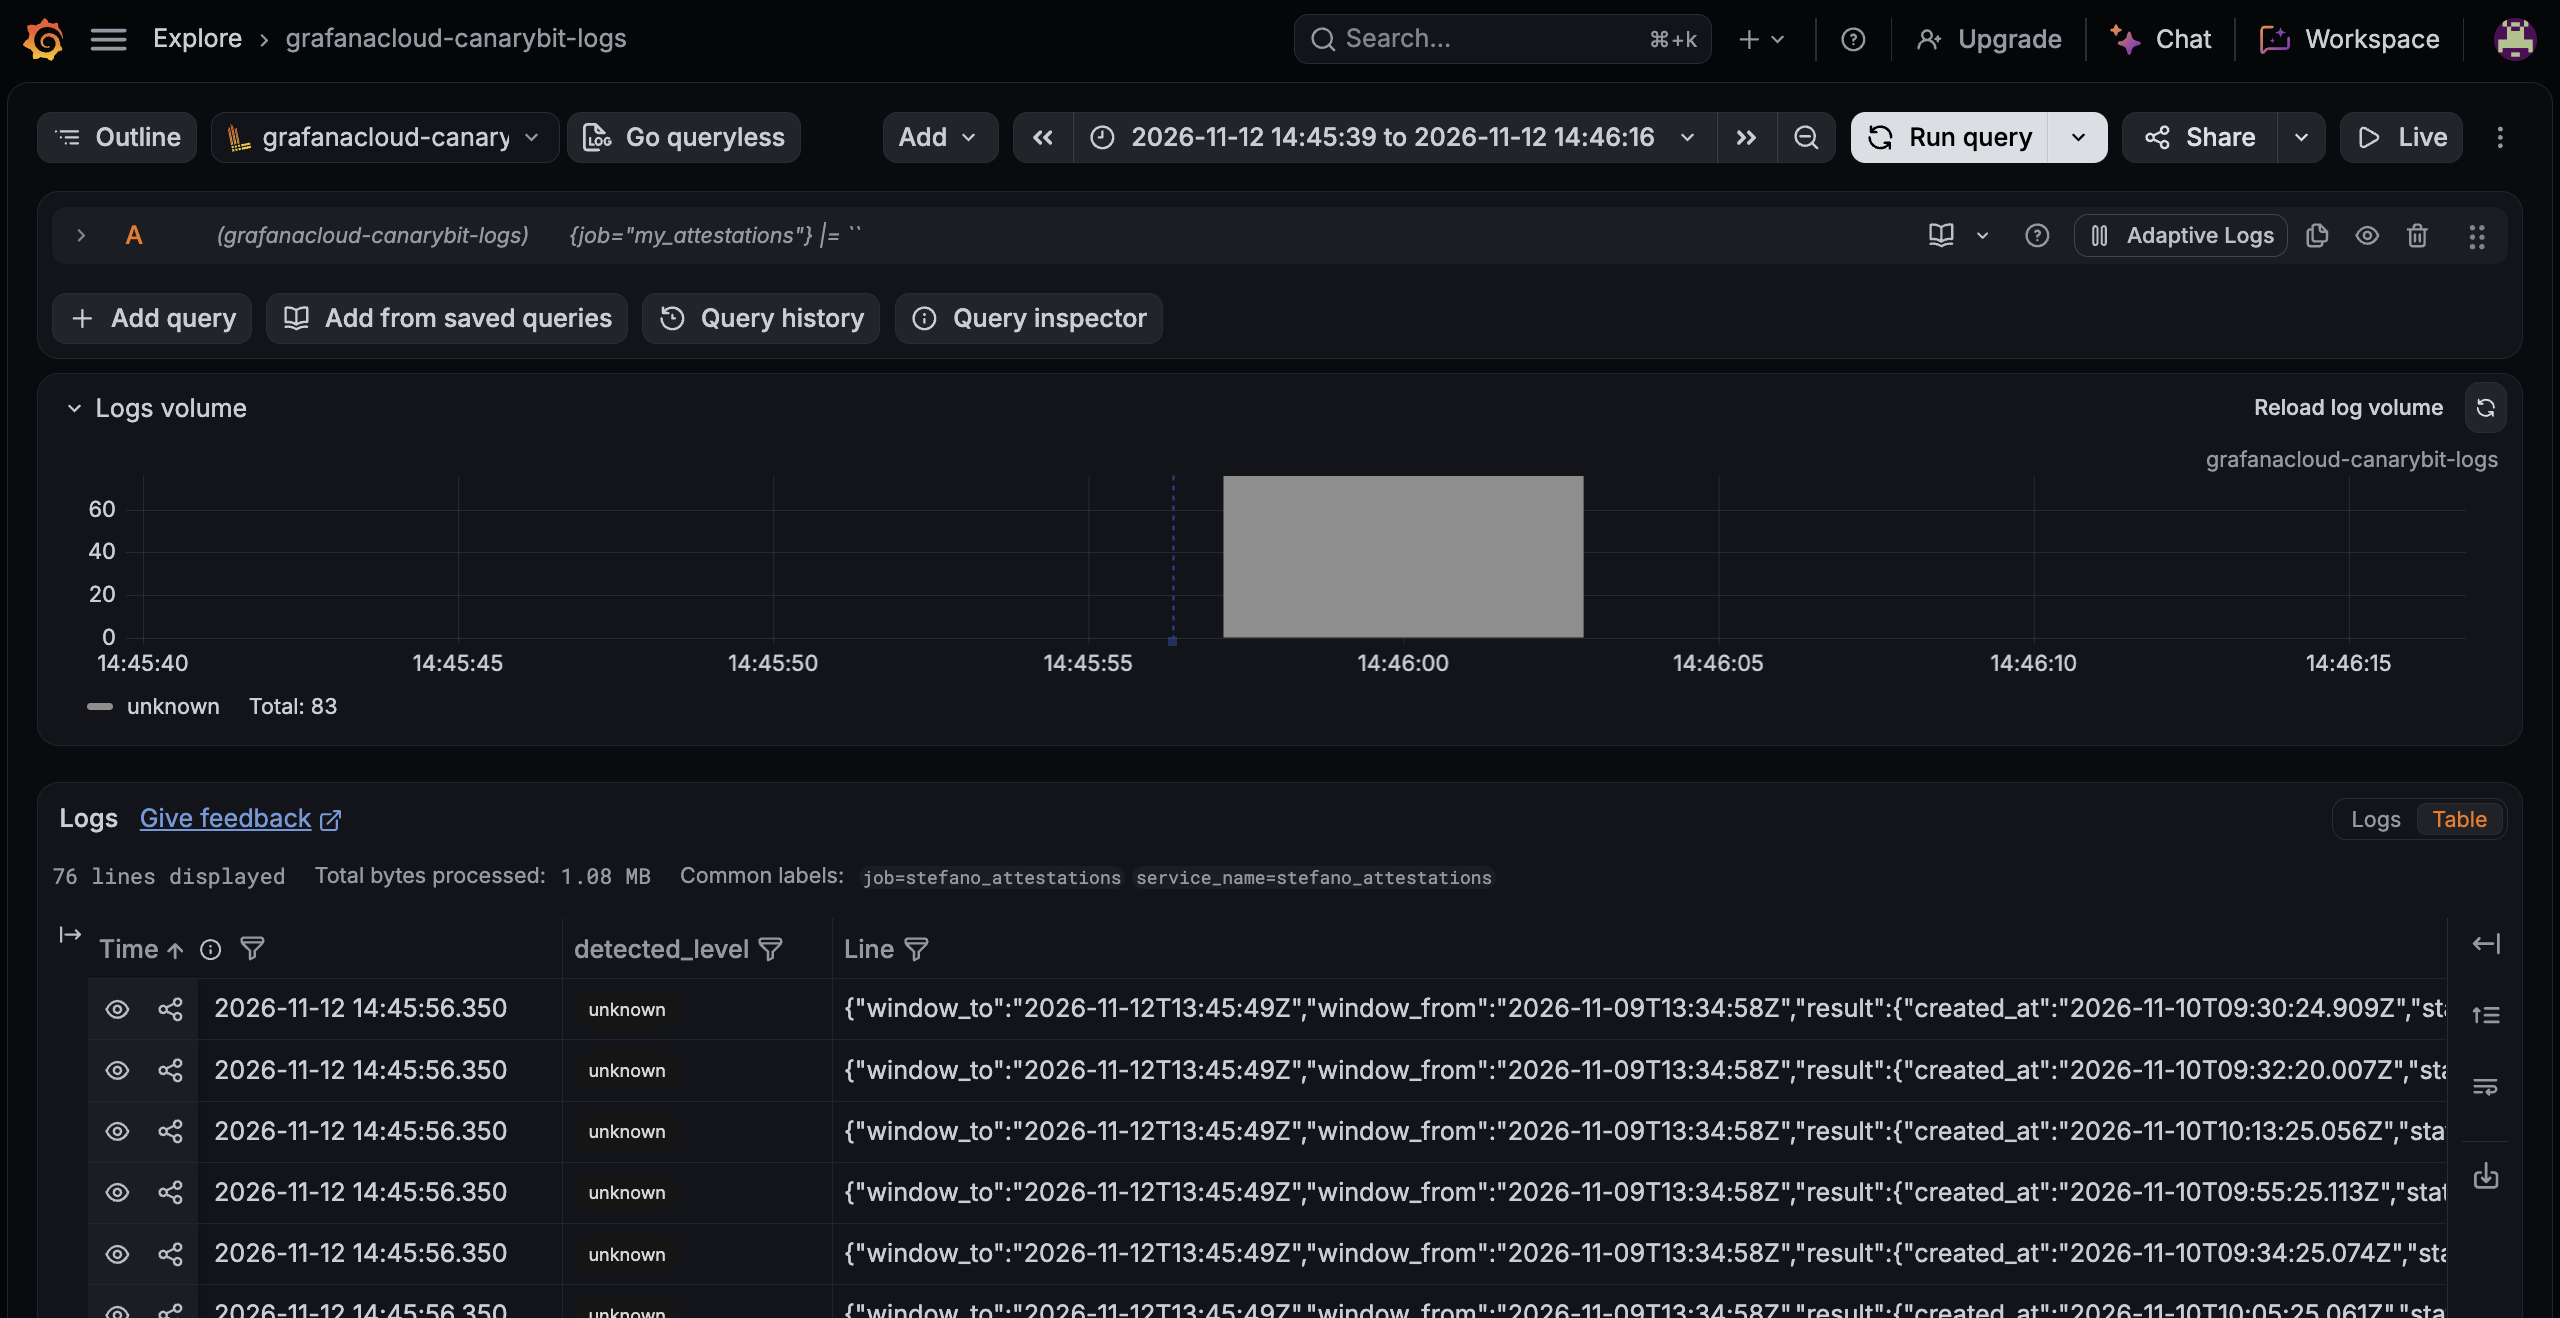
and visualise the return event logs: